

Design preview of a refreshed estradaci.com. Same content as the live site. Compare with today's design

Category Archives: Featured on Home Page

An wide angle image of a government building and government workers showing AI-assisted coding going through a gatekeeper process

Can AI-Generated Code Survive a State Audit?

Building a Governance-First Pipeline for Government Software


If you lead IT for a state agency, a county court, or a public university, you have almost certainly been asked some version of this question in the last twelve months.

Can we use AI to write our software faster?

The honest answer is yes. The more important answer is: not without a governance model that a state auditor, a CJIS compliance officer, and your agency counsel would all sign off on.

At Estrada Consulting, we have spent the last two and a half decades delivering application development, data platforms, and enterprise architecture to California agencies and similar public-sector clients across the country. Over the last several months, I have been building and testing a methodology for applying AI-assisted code generation to regulated government software, specifically the kind of workload where CJIS Security Policy, NIST 800-53 zero-trust controls, and PII handling rules cannot be negotiated down.

This post walks through what we have learned, why we believe governance (not raw generation speed) is the real differentiator for SLED agencies, and what a disciplined pipeline actually looks like in practice.


Why “AI writes your code” is the wrong framing for government

Most of the AI coding conversation happening in the broader software industry right now is centered on developer productivity: faster feature delivery, fewer tickets, shorter sprints. That framing works reasonably well for a consumer app or an internal dashboard.

It breaks down almost immediately in a SLED environment, for three reasons.

  • Compliance is not an afterthought. A court case intake service that accepts filings from external agencies must enforce CJIS encryption, authenticate every request against the state identity provider, mask personally identifiable information per policy, and produce an audit trail that survives a records request. Speed of code generation is not interesting if the generated code cannot be verified against those mandates.
  • Accountability is specific and personal. When an IT architect signs off on an integration, a security validator approves an encryption approach, or a chief data officer accepts an interoperability mapping, those are not ceremonial steps. They are the record the agency will point to when something is questioned later. Any methodology that bypasses or obscures those approvals is a non-starter.
  • Change is continuous. Policies shift. Canonical schemas get revised. New mandates come down from federal agencies. A system that was correctly built two years ago may need targeted reconstruction tomorrow, and the agency needs to know exactly which components are affected by a given policy change without re-reviewing the entire codebase.

These realities do not argue against using AI in government software delivery. They argue for using it inside a framework that treats governance as the primary design constraint.


What this looks like in practice

This governance-first approach is not theoretical. We are already applying these principles in active client engagements where compliance, auditability, and data integrity are non-negotiable.

Example: Cloud-native case management and compliance platform (Public Health / Judicial Integration)

In a recent engagement, we designed and delivered a cloud-native platform to manage client treatment workflows, HR compliance, and judicial reporting requirements. The system supports the full lifecycle of regulated case data, from intake through disposition, while enforcing strict controls around personally identifiable information (PII), access, and auditability.

Key characteristics of the solution included:

  • Role-based access control and secure authentication aligned with least-privilege principles
  • End-to-end audit trails for all data changes and workflow actions
  • Configurable validation rules and workflows to enforce policy at the application layer
  • Cloud-native architecture (Azure) designed for scalability, resilience, and secure data handling
  • Integrated data pipelines to manage ingestion, transformation, and reporting with traceability

What is notable is not just the technology, but the structure: requirements were translated into explicit data, workflow, and policy definitions before implementation. This mirrors the same principle behind the IMHOTEP pipeline, formalizing intent first, then generating and validating implementation artifacts in a controlled, auditable way.

This is the direction we see across agencies: AI and automation are being introduced, but only within systems that can demonstrate control, traceability, and compliance from the ground up.


What has changed in the last 12–24 months

The conversation around AI in government software delivery has shifted significantly in a short period of time.

First, AI capabilities have moved from experimental to embedded. Tools such as natural language querying, automated reporting, and anomaly detection are now being integrated directly into enterprise data platforms. In multiple recent engagements, we have implemented AI-assisted features, such as forecasting models, anomaly detection, and natural language interfaces, on top of governed data environments rather than as standalone experiments.

Second, cloud-native architectures have become the default foundation for modernization. Agencies are no longer simply migrating systems; they are rebuilding them using scalable, modular patterns that support continuous integration, automated deployment, and policy-driven controls. This shift is essential for enabling AI safely, because it creates the infrastructure needed for repeatable validation and enforcement.

Third, expectations around governance have increased, not decreased. As AI accelerates development, agencies are placing greater emphasis on:

  • Data lineage and traceability
  • Policy enforcement at the system level
  • Repeatable validation and testing processes
  • Clear accountability for approvals and changes

In other words, AI is compressing the software development lifecycle, but it is also raising the bar for control. The agencies that are succeeding are not the ones generating code the fastest, but the ones that can prove, at any point in time, that their systems behave as intended and comply with policy.

This is the context in which a governance-first pipeline becomes not just useful, but necessary.


A disciplined pipeline, in plain language

The methodology we have been refining, internally referred to as the IMHOTEP pipeline, organizes AI-assisted software delivery into five sequential phases. Each phase has a specific owner, a specific deliverable, and a specific approval gate. Nothing advances to the next phase until the prior phase has been formally accepted.
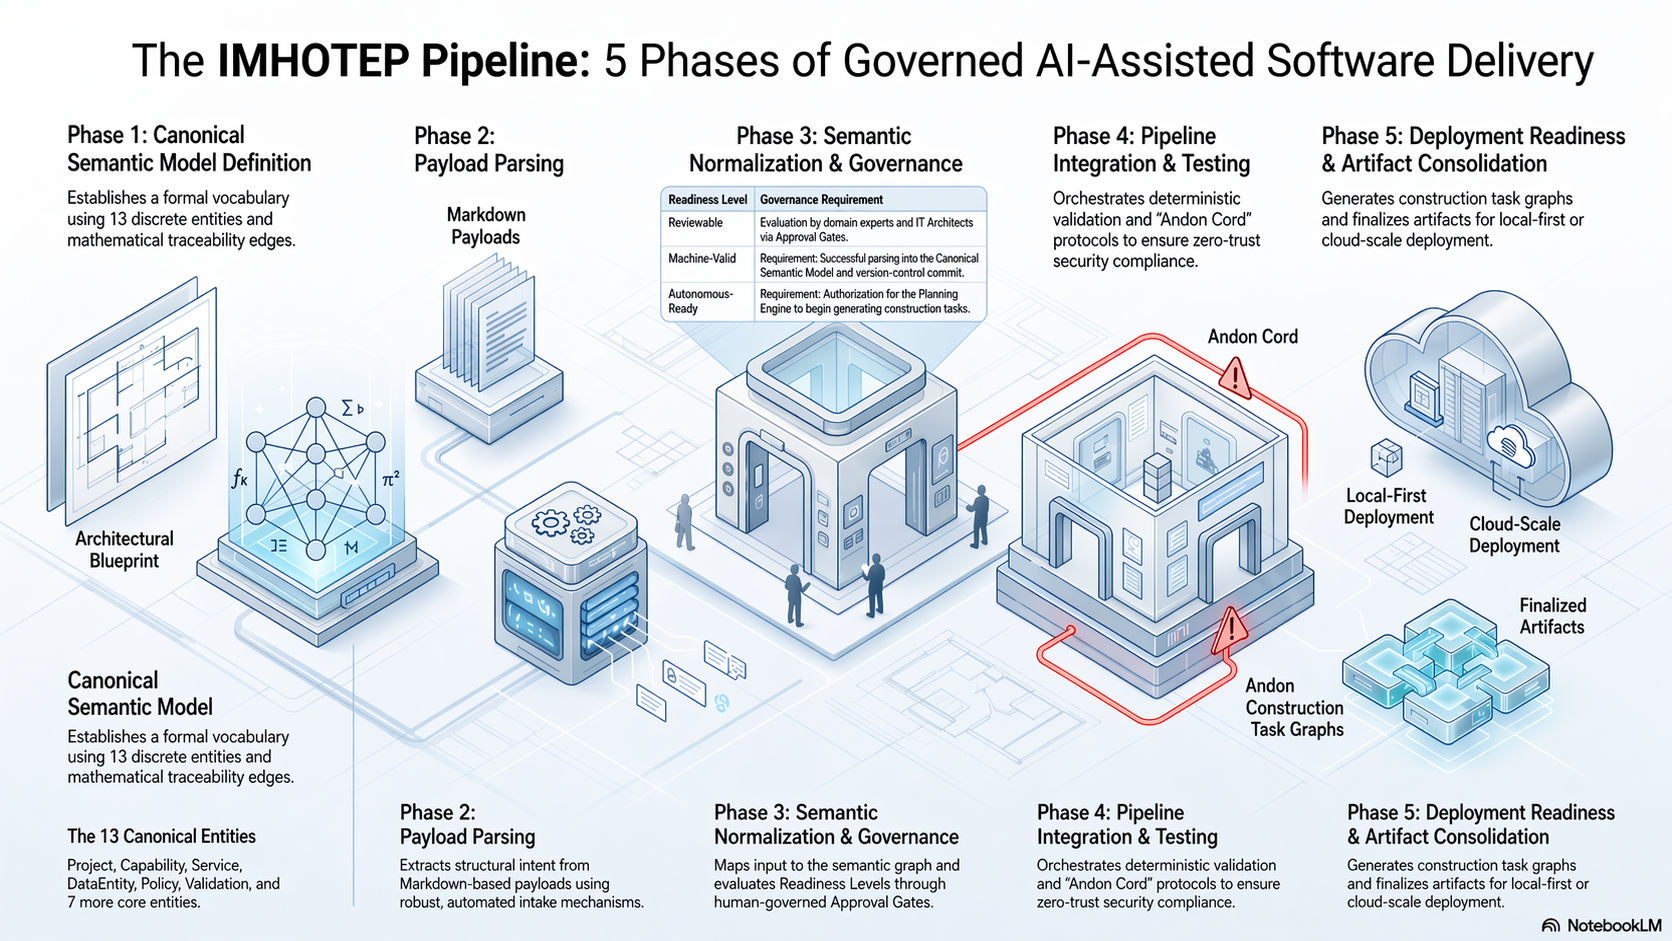
An infographic illustrating the 5 Phases of Governed AI-assisted Software Delivery

View full-size infographic (opens in new tab) →


Phase 1: Canonical Semantic Model Definition. Before any code is generated, human experts define what the system must do using a formal vocabulary of thirteen entity types, including Project, Capability, Service, DataEntity, Policy, Validation, and seven additional core constructs. This produces a structured, machine-readable specification rather than a loose requirements document. The specification is version-controlled and traceable.

Phase 2: Architectural Blueprint and Formal Approval Gates. Authored as structured Markdown with YAML frontmatter, the blueprint (called a Structured Transaction Payload) becomes the machine-parseable definitive intent for the system. Before anything advances to code generation, named governance roles sign off: IT Architects approve the API definitions, Security Validators approve the encryption and authentication posture, and the Chief Data Officer and court auditors approve the interoperability mappings to the agency’s canonical schema. Only after these approval gates close does the blueprint reach the “Autonomous-Ready” level.

Phase 3: Semantic Normalization and Governance. The approved blueprint is mapped into a semantic graph and committed to a version-controlled artifact repository, establishing the authoritative architectural baseline. This is the handoff point where the formal specification becomes the single source of truth that every downstream artifact, code, tests, and deployment manifests, must trace back to.

Phase 4: Pipeline Integration and Testing. Deterministic test suites are generated to verify that the implementation strictly satisfies the policies captured in the specification. Tests are not generic quality checks; they are formal verifications mapped to specific policy identifiers. If the code does not satisfy a policy, the pipeline halts. This is the “Andon Cord” principle, borrowed from Toyota manufacturing: any worker, human or automated, can stop the line when something is wrong.

Phase 5: Deployment Readiness and Artifact Consolidation. Once the code satisfies all deterministic validations, it is packaged into containerized deployment artifacts, along with a bidirectional traceability graph that mathematically links every piece of generated code back to the specific requirement it satisfies. That traceability graph is what allows an auditor, months or years later, to ask “show me every line of code that implements CJIS encryption policy POL-CJIS-001” and receive a precise, verifiable answer.


Applying the pipeline to a court case intake service

To validate this methodology, we developed a proof-of-concept: a REST service that accepts court case filings, enforces Entra ID authentication, validates incoming payloads against the canonical court data schema, applies PII masking rules, and persists records with full audit metadata. The service was built in .NET/C#, containerized for local-first deployment, and evaluated against a deterministic test suite mapped directly to CJIS, NIST 800-53, and PII policy requirements.

What matters about the proof-of-concept is not the specific technology stack. What matters is that every design decision, every line of generated code, and every test case can be traced back to an approved requirement authored by a named human in a governance role. If a court auditor asks tomorrow why a particular field is masked, or why a particular endpoint rejects an unauthenticated request, the answer is not in a developer’s head. It is in the traceability graph.


Why this matters for California SLED agencies

California state, local, and education agencies operate under some of the most rigorous procurement and compliance frameworks in the country. CMAS, TDDC, and MSA procurement vehicles; state-level data governance mandates; agency-specific security policies layered on top of federal CJIS and NIST requirements; and a public records environment that demands defensible documentation of every technology decision.

In that environment, a consulting partner that can demonstrably produce software with:

  • A formal, version-controlled specification signed off by named governance roles
  • Deterministic test evidence mapped to specific compliance policies
  • Bidirectional traceability from requirement to code to test to deployment artifact
  • A documented escalation pathway when the automated pipeline encounters a conflict it cannot resolve

That kind of partner offers something materially different from one that simply delivers working code on a reasonable timeline. Working code is the baseline. Defensible, auditable, policy-traceable code is the deliverable that state agencies and their oversight bodies actually need.


Where we go from here

We are continuing to refine this methodology across additional government use cases, including data integration pipelines, legacy modernization efforts, and business intelligence workloads where source data carries compliance constraints. Our experience over the last twenty-five-plus years delivering for agencies like CA – Dept of Corrections and Rehabilitation, CA – Dept of Justice, CA – Dept of Managed Healthcare, CA – Dept of Technology, and WA Sound Transit has shaped how we think about governance, and this pipeline is a direct extension of that institutional discipline, applied to a new generation of tooling.

If you are an IT leader at a California SLED agency thinking through how to responsibly introduce AI-assisted development into your portfolio, or a program manager who needs to answer hard questions from auditors and stakeholders about how AI-generated software will be governed, we would welcome a conversation.
Learn more about ECI’s government-focused AI services →

Cartoon red lobster winking and waving next to a circuit board pattern. Large text reads: Beyond the Hype, What I Learned Running OpenClaw AI Agents.

Beyond the Hype: Real-World Lessons Running OpenClaw AI Agents

Beyond the Hype: What I Learned Running OpenClaw AI Agents as an IT Consulting Company President


I have been tracking the promise of AI agents for a while. Not just chatbots that answer questions, but systems that can actually do work in the background, run reliably, and take on real tasks the way a capable assistant would. As the president of a small IT consulting firm, I am constantly looking for practical ways to reduce friction, speed up execution, and make sure nothing important slips through the cracks.

That is what led me into this hands-on exploration. And if I am being honest, the platform naming itself became part of the story. During my setup I got caught in real time product renaming. I installed Moltbot on my PC first, and by the time I moved to a Mac Mini and got a clean environment running, I was installing and operating under the OpenClaw name. If you are evaluating this space, that detail matters because the technology is moving fast and the ecosystem is still settling.


Why I did this?

My goal was simple. I wanted an agent I could rely on to help me stay ahead of day-to-day operations, not just react to them.

For me, that looks like a few very specific outcomes.

  • Keeping an eye on the scheduling items that actually matter, the meetings that trigger deliverables, the milestones that create pressure, the dates that cannot slip, and making sure I do not get surprised by any of them.
  • Catching follow ups automatically by reviewing Gemini meeting notes and flagging action items I should respond to, delegate, or track, without me having to re-read everything after the fact.
  • Producing clean status summaries by scanning Azure DevOps comments and progress so I can get a real snapshot of where projects stand without chasing updates across multiple threads.
  • And eventually doing deeper work like scanning contract language and negotiation terms for patterns and risks so that contract review gets faster, more consistent, and less dependent on someone remembering what happened last time.

If you are an executive or IT leader, you know the real cost is not just time. It is context switching, missed follow ups, and the mental load of carrying too many moving parts.


My initial setup and the first hard lesson

I started on a Windows machine and installed Moltbot using Docker. The decision to use Docker was intentional. With agentic AI, security is not optional. The underlying capability is evolving quickly, and the nature of what these agents can do is expanding. From day one, I wanted isolation and control over what the agent could access, where it could write data, and how it could interact with my environment.

That instinct paid off, but the first major blocker showed up quickly when I tried to make it useful with real business tools.


The moment of truth was Google Chat

A major part of my evaluation was whether I could integrate Moltbot into the same collaboration flow my team actually uses. I tried to get Moltbot working with Google Chat, and it became obvious that a key dependency conflict was going to make that impossible or at least extremely difficult in my Windows setup.

The core issue was Homebrew. A required skill chain expected a Mac OS environment, and Homebrew was not going to install cleanly in the way the agent needed. I could get some things working, including tools like WhatsApp and Telegram, but when it came to the systems that run the business, Google Chat was the test that exposed the gap.

At that point I had a decision to make. Keep forcing the environment, or pivot to an environment that would let me test the platform honestly.

So I bought a Mac Mini (not an easy decision, since I’ve never owned anything Apple besides a IPad v1).


Mac Mini deployment and why isolation still mattered

Setting up the Mac Mini was unsurprisingly smooth, even as someone who has not lived inside the Apple ecosystem day to day. The biggest adjustment was shortcut muscle memory (where’s my Windows + E shortcut?). The bigger win was stability and compatibility.

But the security requirement did not change. If anything, it became more important. With agentic systems, you are not just testing a tool, you are evaluating an automation layer that can take actions on your behalf. So, I still wanted separation between my host machine and the agent runtime.

That is why I used Parallels to create an isolated Ubuntu instance on the Mac Mini.

This gave me a contained environment similar to what Docker provided on the PC, but with the added benefit of running on an operating system that satisfied the dependency chain. In that Ubuntu instance, I installed OpenClaw and everything moved quickly. The Homebrew related conflict that blocked me on Windows was no longer the primary issue, and I was able to get the platform running in a way that felt aligned with how it is meant to operate.


The discovery that changed everything for me: the TUI

One of the best surprises was the OpenClaw Technical User Interface, the TUI.

This matters because it changes how you interact with the agent. Instead of constantly copying and pasting commands, juggling multiple AI tools, or running long command sequences manually, the TUI lets you operate in natural language inside a shell environment.

In practice, that means you can ask in plain language, see what it is doing, troubleshoot in place, and move faster with less context switching.

I used it for real problem solving almost immediately, including diagnosing why agents were going offline due to Mac power saving behavior. I also used it to request proactive checks and health type reporting so I could see whether the bots were behaving as expected without me constantly babysitting them.


My first two agents and what that revealed

To test specialization early, I created two agents with different focus areas and ran them as bots in Telegram.

One is execution oriented, an IT professional mindset, built to drive tasks forward and help with operational follow through.

The other is marketing and business development oriented, built to support growth activities, outreach, and content.

Even in this early stage, splitting responsibilities was useful because it forced me to think the way you would think if you were staffing a team. What is this role responsible for. What does success look like.

What should it ignore.

That is an important mental shift for leaders. Agents are not just software features. If you want them to produce value, you have to scope them the way you would scope junior staff, with clear responsibilities, guardrails, and oversight.


Operational realities you need to know up front

Here is the type of real-world detail you only learn by running this yourself.

Major host OS updates can break remote continuity. In my case, after significant Mac Mini updates, the system required a manual physical login. That means remote access is interrupted until someone is physically present to complete the login step.

If you are picturing always on agents running remotely, this is not a deal breaker, but it is a real operational requirement. You either plan around it, or you design redundancy, so an update does not take your automation offline.


Where I think this is going and why it matters for executives

The bigger vision is not one bot. It is a team of specialized agents.

Over time, I want a stack that looks more like a small internal department. A scheduling and follow up agent that watches the calendar for the items that trigger real work, and makes sure the right people are ready before deadlines show up.

  • A status and delivery agent that reads the signals already sitting in our tools, especially Azure DevOps comments and progress, and turns them into clear updates a leader can act on.
  • A business development agent that supports outreach and content in a consistent way without requiring a constant time investment.
  • And eventually a legal focused agent trained on our company contracts and negotiation patterns, something that can proactively flag risks, identify nonstandard terms, and support faster review before things hit my desk

What’s upcoming

The next phase is less about getting it running and more about making it genuinely useful inside the flow of work.

My focus is on

  • Giving each agent its own email and calendar access so it can operate with clean boundaries and auditable permissions.
  • Training each agent more intentionally so the execution focused one stays execution focused and the business development one stays business development focused
  • Building lightweight routines that force consistency, things like daily check ins, weekly summaries, and proactive follow ups
  • Testing what happens when the agent is expected to run like a reliable service, not a weekend experiment

I will keep sharing updates as I go, including what works, what breaks, and what I would recommend to anyone evaluating OpenClaw in a business environment.

And I will end with one last thought. What started as a simple Mac Mini setup quickly escalated. Initially, I connected just one monitor (of my three-monitor setup), telling myself this was a temporary test. Then I added another. Before long, I had a whole array of monitors and tools (Dropbox, Office, etc.), and suddenly my test machine had more attraction than my main setup. So now I have to ask the real question. Did I just upgrade my desktop unintentionally and am I becoming a Mac person?

ECI GovData Guide – resource for government data, governance, and analytics

Introducing the ECI GovData Guide

Introducing the ECI GovData Guide: Better Data, Clearer Governance, Smarter Insights

Government agencies and large organizations are managing more data than ever. From transportation and health systems to enterprise operations and finance, teams are under pressure to deliver timely, accurate insights while maintaining trust and accountability.

At Estrada Consulting, Inc. (ECI), we have seen firsthand how difficult it can be to balance these demands. That is why we built the ECI GovData Guide, a public resource designed to help government and large organizations improve data quality, strengthen governance, and accelerate analytics outcomes.

Open the ECI GovData Guide


What It Does

The GovData Guide draws from real-world knowledge and case studies based on ECI’s extensive consulting experience. It helps teams:

  • Use AI-driven methods to identify data anomalies and outliers more quickly and accurately
  • Translate BI and data warehousing concepts into clear, accessible language for non-technical stakeholders
  • Draft KPIs and governance templates based on proven checklists and SOW examples
  • Accelerate validation and reporting cycles to move from raw data to insight more quickly
  • Provide guidance on ADA-compliant dashboard and reporting practices to improve accessibility and transparency
  • Strengthen data governance and security planning, including standards alignment and role-based access controls

Why It Matters

Complex data environments, regulatory requirements, and growing expectations for transparency make consistency and trust essential. The GovData Guide provides a way to explore proven data practices and, where appropriate, apply AI-assisted techniques that improve speed and accuracy.

With the GovData Guide, organizations can bridge the gap between everyday data challenges and best practices in BI, governance, accessibility, and anomaly detection. It distills proven approaches into an accessible format that any team can use, while also reflecting the standards ECI applies in its consulting work.


Try It Today

We invite government and large organizations to try the tool and share feedback.

Open the ECI GovData Guide


About Estrada Consulting, Inc.

Estrada Consulting, Inc. (ECI) is a data-first IT consulting firm serving government and commercial clients. We specialize in data, business intelligence, and analytics, and we also deliver custom application development and full lifecycle project management. We connect strategy, software, and data to deliver business value at scale.

Learn more about ECI’s Data & Analytics services that support modernization initiatives across government and enterprise.

A stack of abstract, translucent geometric layers in blue and white, representing a modern data platform with interconnected nodes.

A Practical Guide to ETL and ELT with Databricks

By Eduardo Sobrino, BI/EDW Data, Analytics and AI Practice Manager, Estrada Consulting Inc.

Introduction

As organizations continue to amass data at unprecedented volumes and velocity, the ability to reliably move, transform, and prepare that data for analysis has become mission-critical.

ETL (Extract, Transform, Load) and ELT (Extract, Load, Transform) processes lie at the heart of this challenge, acting as the foundational pipelines that feed downstream analytics, reporting, and machine learning workflows.

Yet, traditional ETL/ELT systems often struggle with complexity, scalability, and governance—leaving data teams to grapple with performance bottlenecks, compliance risks, and operational overhead. Overcoming these challenges is a core focus of our Data & Analytics services.

Databricks addresses these fundamental concerns with a cloud-native architecture that decouples management from execution through its control plane and data plane model. This separation ensures that sensitive data stays securely within an organization’s cloud environment, while orchestration and interface layers remain centrally managed. It’s a structure designed to support compliance-driven industries like finance and healthcare, where data sovereignty, auditability, and fine-grained security controls are paramount.

Equally important is the platform’s ability to scale and adapt. With built-in support for both batch and streaming workloads, Databricks empowers organizations to respond to real-time data needs without sacrificing throughput. Features like autoscaling Spark clusters, the high-speed Photon engine, and tools like Delta Live Tables (DLT) allow teams to build pipelines that are both performant and resilient.

Whether transforming millions of records in a nightly batch or ingesting event data continuously, Databricks provides the flexibility and reliability that modern analytics demands.

Beyond infrastructure, Databricks emphasizes collaboration, reusability, and governance. Through shared notebooks, Git integration, and orchestrated workflows, data engineers and analysts can work together to build modular pipelines that are versioned, tested, and monitored end-to-end. Tools like dbt, Auto Loader, and structured streaming support a wide range of ETL/ELT patterns while maintaining clarity and control over transformation logic. The result is not just operational efficiency, but a stronger, more agile foundation for enterprise data strategies.

The Core Architecture: The Role of the Control and Data Planes in ETL/ELT

Databricks’ control plane and data plane architecture plays a critical role in optimizing ETL/ELT pipelines by separating platform management from data processing. This separation improves scalability, security, performance, and operational efficiency in modern data workflows. Databricks operates using two main components:

  • Control Plane: This is managed by Databricks and includes backend services like the web application, REST APIs, and account management. It handles metadata, job orchestration, and user interfaces. Essentially, it manages the “brains” of the operation, ensuring everything runs smoothly.
  • Data Plane: This is where the actual data processing happens. It operates within your cloud account (e.g., AWS, Azure, or GCP) and handles tasks like running clusters, executing jobs, and storing data. The Data Plane ensures that your raw data remains within your cloud environment, maintaining security and compliance.

How This Architecture Enhances ETL/ELT

1. Separation of Duties & Security

  • Data never leaves your cloud environment: The data plane resides in your VNet or VPC, so sensitive data remains fully under your control.
  • Tight governance: You can apply your own IAM, network security rules, and auditing on the data processing environment.
  • Private Link support (e.g., Azure Private Link): Isolates data processing from public internet access.
  • Benefit: Enables secure, compliant ETL/ELT pipelines—essential for regulated industries (e.g., healthcare, finance).

2. Scalability and Performance

  • The data plane scales independently based on the workload.
  • Databricks optimizes Spark clusters dynamically (with autoscaling) to handle spikes in ETL/ELT demand.
  • The Photon engine in the data plane delivers massive speed-ups for SQL-based ELT transformations.
  • Benefit: Large batch ETL and real-time ELT jobs run faster and more cost-efficiently.

3. Centralized Orchestration and Job Management

  • The control plane manages jobs, notebooks, workflows, and integrations (e.g., with Airflow, Azure Data Factory, or AWS Step Functions).
  • Features like job clusters and parameterized workflows streamline the creation and monitoring of complex pipelines.
  • Benefit: Simplifies pipeline development and makes ETL orchestration robust and maintainable.

4. Collaborative Development Environment

  • Control planes provide notebooks, version control (via Git), and access control to promote collaborative development.
  • Supports Delta Live Tables, which abstracts complex ETL logic into declarative pipelines.
  • Benefit: Encourages shared ownership and modular, testable pipeline code across data engineers and analysts.

5. High Availability & Fault Tolerance

  • The control plane ensures high availability of jobs and metadata.
  • The data plane uses Spark’s resilient architecture to recover from worker failures during transformations.
  • Benefit: Increases the reliability of long-running ETL/ELT jobs.

Real-World Example: ETL Using This Model

  • Trigger Job: A scheduled job is initiated from the control plane.
  • Launch Cluster: The job spins up a Spark cluster in your data plane.
  • Ingest + Transform: Raw data from cloud storage is read and transformed using Spark SQL or Python.
  • Write Output: Cleaned and structured data is written back to Delta Lake, Parquet, or a data warehouse.
  • Monitor: Control plane logs and alerts notify the team of success or failure.

Databricks ETL/ELT Options

Databricks offers a rich ecosystem for building ETL (Extract, Transform, Load) pipelines, supporting both batch and streaming data. Here’s a breakdown of the main ETL options available in Databricks:

1. Delta Live Tables (DLT)

Best for: Declarative, managed ETL pipelines with built-in data quality and lineage.

Languages: SQL or Python

Features:

  • Auto-managed infrastructure
  • Data quality checks with EXPECT
  • Built-in monitoring and lineage
  • Supports both batch and streaming

Examples:

# dlt_table.py
import dlt
from pyspark.sql.functions import col

@dlt.table(
  comment="Raw data from the source system"
)
def raw_orders():
  return spark.read.format("json").load("/databricks-datasets/retail-org/orders")

@dlt.table(
  comment="Cleaned and filtered orders"
)
def clean_orders():
  return (
    dlt.read("raw_orders")
    .filter(col("amount") > 0)
    .withColumnRenamed("customer_id", "cust_id")
  )
-- Create a materialized view for daily sales
CREATE OR REFRESH LIVE TABLE daily_sales_mv
AS
SELECT
  date_trunc('DAY', timestamp) AS sale_day,
  SUM(amount) AS total_sales,
  COUNT(*) AS order_count
FROM LIVE.clean_orders
GROUP BY date_trunc('DAY', timestamp);
-- Define a streaming live table using Auto Loader
CREATE OR REFRESH STREAMING LIVE TABLE raw_orders_stream
COMMENT "Streaming ingestion of raw order data from cloud storage"
AS SELECT *
FROM cloud_files(
  "/mnt/data/streaming/orders",  -- Replace with your path
  "json",
  map(
    "cloudFiles.inferColumnTypes", "true",
    "cloudFiles.schemaLocation", "/mnt/schemas/raw_orders_stream"
  )
);


Feature Tool Key Benefit
Live Tables DLT Declarative ETL with lineage
Streaming Tables Auto Loader + Delta Real-time ingestion
Materialized Views SQL + DLT Fast query performance on aggregates

2. Structured Streaming

Best for: Real-time ETL with low-latency data ingestion.

Languages: PySpark, Scala, SQL

Features:

  • Exactly-once semantics
  • Watermarking and windowing
  • Scalable and fault-tolerant
from pyspark.sql.functions import *
# Define schema
schema = "order_id STRING, customer_id STRING, amount DOUBLE, timestamp TIMESTAMP"
# Read streaming data
streaming_df = (
    spark.readStream.format("cloudFiles")
    .option("cloudFiles.format", "json")
    .schema(schema)
    .load("/mnt/data/streaming/orders")
)
# Write to Delta table
streaming_df.writeStream \
    .format("delta") \
    .option("checkpointLocation", "/mnt/checkpoints/orders") \
    .outputMode("append") \
    .table("streaming_orders")

3. Notebooks (PySpark, SQL, Scala, R)

Best for: Custom ETL logic, ad hoc transformations, and data exploration.

Languages: Python, SQL, Scala, R

Features:

  • Full control over logic
  • Easy to schedule with Jobs
  • Integrates with ML workflows

4. Auto Loader

Best for: Incremental ingestion from cloud storage (S3, ADLS, GCS).

Features:

  • Schema inference and evolution
  • Scalable file discovery
  • Works with Structured Streaming

5. Databricks Workflows (Jobs)

These are automated pipelines that allow you to schedule and orchestrate tasks in Databricks. You can use workflows to integrate various tasks, such as data ingestion, transformation, and analysis, into a single pipeline. They support features like monitoring, notifications, and artifact archiving.

Best for: Scheduling and orchestrating ETL pipelines.

Features:

  • Task dependencies
  • Retry policies
  • Alerts and monitoring
  • Supports notebooks, JARs, Python scripts, SQL

A sample Databricks Workflow that orchestrates a simple ETL pipeline using notebooks and Delta Live Tables (DLT). This example includes:

  • A data ingestion task
  • A transformation task
  • A DLT pipeline trigger
  • A notification task

Sample Databricks Workflow JSON

{
  "name": "Customer ETL Pipeline",
  "email_notifications": {
    "on_failure": [
      "data-team@example.com"
    ]
  },
  "timeout_seconds": 3600,
  "max_concurrent_runs": 1,
  "tasks": [
    {
      "task_key": "ingest_data",
      "description": "Ingest raw customer data from cloud storage",
      "notebook_task": {
        "notebook_path": "/Repos/your_user/etl/ingest_customers"
      },
      "new_cluster": {
        "spark_version": "13.3.x-scala2.12",
        "node_type_id": "Standard_DS3_v2",
        "num_workers": 2
      }
    },
    {
      "task_key": "transform_data",
      "description": "Clean and enrich customer data",
      "depends_on": [
        {
          "task_key": "ingest_data"
        }
      ],
      "notebook_task": {
        "notebook_path": "/Repos/your_user/etl/transform_customers"
      },
      "new_cluster": {
        "spark_version": "13.3.x-scala2.12",
        "node_type_id": "Standard_DS3_v2",
        "num_workers": 2
      }
    },
    {
      "task_key": "run_dlt_pipeline",
      "description": "Trigger DLT pipeline for CDC processing",
      "depends_on": [
        {
          "task_key": "transform_data"
        }
      ],
      "pipeline_task": {
        "pipeline_id": "<your-dlt-pipeline-id>"
      }
    },
    {
      "task_key": "notify_success",
      "description": "Send success notification",
      "depends_on": [
        {
          "task_key": "run_dlt_pipeline"
        }
      ],
      "notebook_task": {
        "notebook_path": "/Repos/your_user/etl/notify_success"
      },
      "new_cluster": {
        "spark_version": "13.3.x-scala2.12",
     &n"node_type_id": "Standard_DS3_v2",
        "num_workers": 1
      }
    }
  ]
}

What You Need to Customize

  • Replace `notebook_path` with your actual notebook paths.
  • Replace `<your-dlt-pipeline-id>` with your actual DLT pipeline ID.
  • Adjust cluster specs as needed.
  • Add email addresses for notifications.

How to Deploy

  1. Go to Workflows > Create Job in Databricks.
  2. Use the UI or click Import JSON to paste the above.
  3. Save and run the workflow.

6. dbt on Databricks

dbt is a tool for transforming data in your warehouse using SQL. It helps you build, test, and document your data models. When integrated with Databricks, dbt can be used to automate SQL transformations, monitor tasks, and include them in broader workflows. Together with Workflows, dbt enable seamless integration of data transformation tasks with other processes, such as ETL (Extract, Transform, Load) operations or analytics workflows.

Best for: SQL-based transformation pipelines with version control and testing.

Features:

  • Modular SQL models
  • Data testing and documentation
  • Git integration
  • Works with Unity Catalog

7. Partner Tools & APIs

Best for: Integrating with external ETL tools or building custom pipelines.

Examples:

  • Apache Airflow
  • Informatica, Fivetran, dbt Cloud
  • REST APIs for job orchestration

Implementing Smarter ETL/ELT with Change Data Capture (CDC)

Databricks supports Change Data Capture (CDC) through several powerful features and integrations, enabling you to track and process data changes efficiently. In the Databricks platform, CDC transforms ETL/ELT from a resource-heavy batch process into a scalable, real-time, and historically accurate pipeline architecture. It allows data teams to minimize latency, reduce costs, and ensure trust in data—critical requirements for modern analytics and AI initiatives.

Here’s a breakdown of how CDC is handled in Databricks:

1. Delta Lake Change Data Feed (CDF)

Delta Lake provides native support for CDC via Change Data Feed, which allows you to query row-level changes (inserts, updates, deletes) between versions of a Delta table.

Key Features:

  • Track changes between two versions or timestamps
  • Supports INSERT, UPDATE, DELETE
  • Works with batch and streaming

Example:

-- Enable CDF on a Delta table
ALTER TABLE customers SET TBLPROPERTIES (delta.enableChangeDataFeed = true);

-- Query changes between versions
SELECT * FROM table_changes('customers', 5, 10);

2. Delta Live Tables (DLT) with CDC

DLT supports CDC using the APPLY CHANGES INTO syntax, which simplifies building slowly changing dimension (SCD) pipelines.

Example: SCD Type 1 with DLT

APPLY CHANGES INTO LIVE.customers_silver
FROM STREAM(LIVE.customers_bronze)
KEYS (customer_id)
SEQUENCE BY updated_at
COLUMNS * EXCEPT (deleted)
STORED AS SCD TYPE 1;

3. Auto Loader + Merge for CDC

You can use Auto Loader to ingest CDC logs (e.g., from Debezium, SQL Server, Oracle) and apply changes using MERGE.

Example:

MERGE INTO target_table AS t
USING source_stream AS s
ON t.id = s.id
WHEN MATCHED THEN UPDATE SET *
WHEN NOT MATCHED THEN INSERT *;

4. Partner Integrations

Databricks integrates with CDC tools like:

  • Fivetran
  • Debezium
  • Qlik Replicate
  • Informatica

Managing Historical Data with Slowly Changing Dimensions (SCD)

A Slowly Changing Dimension (SCD) is a fundamental data modeling technique used to manage changes in dimensional data over time. This is particularly important when dealing with business entities such as customers, products, or employees—records that don’t change often, but when they do, those changes must be either tracked historically or updated appropriately. The challenge lies in deciding whether to preserve past values for historical accuracy or simply overwrite them to reflect the latest information.

SCD Type 1 and 2

Databricks supports key SCD strategies, most notably SCD Type 1 and Type 2, through its Delta Lake and Delta Live Tables (DLT) frameworks. In an SCD Type 1 approach, the system overwrites old data with new values, effectively discarding history. This is suitable for scenarios where changes are corrections or where historical data is not relevant.

On the other hand, SCD Type 2 is designed to maintain a complete history of changes. Instead of replacing existing records, a new version of the record is inserted while the older one is marked as inactive or expired. This method is critical for analytical use cases where understanding how an entity evolved over time is essential—such as tracking a customer’s address history or product pricing changes.

Approach

What makes Databricks particularly powerful for implementing SCD logic is its support for declarative, scalable, and streaming-friendly pipelines. Using Delta Live Tables, developers can define SCD Type 2 behavior with simple syntax, letting Databricks handle the heavy lifting—like tracking keys, ordering updates, and managing record versions. These capabilities are seamlessly integrated with Delta Lake’s ACID transactions and schema evolution features, ensuring data consistency even at scale.

In practice, this means organizations can build and maintain accurate, audit-ready data models without the complexity often associated with traditional ETL tools. Whether for compliance, reporting, or advanced analytics, SCDs in Databricks provide a reliable and efficient way to track data evolution over time—empowering teams to trust their data and derive deeper insights from it.

Scenario

Here’s a complete CDC (Change Data Capture) example using Delta Live Tables (DLT) in Databricks, implementing Slowly Changing Dimension (SCD) Type 2 logic. You have a source table `customers_bronze` with CDC data (including inserts and updates), and you want to maintain a historical record in `customers_silver`.

1. Create the Source Streaming Table

CREATE OR REFRESH STREAMING LIVE TABLE customers_bronze
AS SELECT *
FROM cloud_files(
  "/mnt/data/customers_cdc",  -- Replace with your path
  "json",
  map(
    "cloudFiles.inferColumnTypes", "true",
    "cloudFiles.schemaLocation", "/mnt/schemas/customers_bronze"
  )
);

2. Apply CDC with SCD Type 2 Logic

APPLY CHANGES INTO LIVE.customers_silver
FROM STREAM(LIVE.customers_bronze)
KEYS (customer_id)
SEQUENCE BY updated_at
COLUMNS * EXCEPT (deleted)
STORED AS SCD TYPE 2;

Expecting:

  • KEYS (customer_id): Identifies the unique record.
  • SEQUENCE BY updated_at: Orders change chronologically.
  • SCD TYPE 2: Maintains history by closing old records and inserting new versions.

3. Query the Resulting Table

SELECT * FROM LIVE.customers_silver
ORDER BY customer_id, effective_date DESC;

This will show the full history of changes for each customer.

Optional: Add Data Quality Checks

CREATE OR REFRESH LIVE TABLE validated_customers
CONSTRAINT valid_email EXPECT (email LIKE '%@%')
AS SELECT * FROM LIVE.customers_silver;

Requirements

  • Delta Live Tables Enabled.
  • Cloud storage path for CDC data.
  • JSON or CSV files with CDC format (e.g., from Debezium, Fivetran).

Stronger Together: Integrating ADF, ADLS, and Databricks

Integrating Azure Databricks with Azure Data Factory (ADF) and Azure Data Lake Storage (ADLS) creates a powerful, end-to-end data platform that unifies orchestration, storage, and scalable data processing.

ADF serves as the control center, orchestrating the flow of data from diverse sources into ADLS, where it is securely and cost-effectively stored in its raw or curated form. This separation of concerns allows for flexible pipeline design, centralized control, and automation of complex workflows with minimal manual intervention.

Databricks complements this architecture by providing the processing and transformation engine. It reads data directly from ADLS, applies complex business logic or machine learning models using high-performance Spark clusters, and writes transformed outputs back to the data lake.

ADF seamlessly triggers Databricks notebooks or pipelines as part of broader ETL/ELT workflows, enabling smooth coordination between data movement and processing tasks. This modular, cloud-native approach scales with demand and supports both batch and streaming data processing. As a Microsoft Gold Partner, we specialize in architecting these powerful, integrated cloud solutions.

ADF + ADLS + Databricks Integration

Component Primary Role Key Capabilities How It Integrates with Others Benefits of Working Together
Azure Data Factory (ADF) Orchestration & ETL/ELT pipeline management – Data ingestion from 100+ sources
– Scheduling & monitoring
– Control flow logic
– Parameterization
– Triggering compute jobs
– Loads data into ADLS
– Triggers Databricks notebooks via activities
– Passes parameters to notebooks
– Central control of data flow
– Decouples logic from orchestration
– Simplifies cross-service coordination
Azure Data Lake Storage (ADLS) Centralized data lake for storage – Scalable, secure object storage
– Delta Lake support
– Fine-grained access control (ACLs)
– Native Azure AD integration
– Stores raw and processed data for Databricks
– Serves as input/output for ADF pipelines
– Unified storage layer
– Enables raw-curated-refined data zoning
– Cost-effective and durable
Azure Databricks Scalable data transformation & analytics engine – Distributed compute with Apache Spark
– Delta Lake transactions
– Machine Learning & AI integration
– Real-time and batch processing
– Reads/writes directly to ADLS (via mounted paths or ABFS)
– Triggered by ADF for processing steps
– Returns output paths for downstream steps
– High-performance transformations
– Advanced analytics & ML-ready
– Unified processing for batch/streaming

Why They Work Better Together

Integration Point Description Resulting Benefit
ADF → ADLS ADF stages raw or staged data into ADLS from external/internal sources Enables centralized, scalable, and secure data storage
ADF → Databricks ADF pipeline activity triggers Databricks notebooks/jobs for transformation logic Separates orchestration from computation; supports modular architecture
Databricks ↔ ADLS Databricks reads/writes to Delta/Parquet/CSV in ADLS directly via high-performance IO Provides scalable, schema-evolving storage optimized for analytics
Databricks → ADF (optional feedback loop) Databricks can log outputs or status that ADF uses for conditional branching or error handling Supports dynamic and intelligent pipeline flows

End-to-End Use Case Example

Step Tool Action
Ingest external data Azure Data Factory Pulls data from SQL Server/SaaS/API to raw zone in ADLS
Transform data into clean format Databricks Processes raw data using Spark or SQL; applies business rules; writes to silver zone in ADLS
Curate analytical models Databricks Generates aggregates, dimensions, and facts; stores in Delta Lake format in gold zone
Load into analytics layer ADF / Databricks Moves final datasets to Synapse, Power BI, or ML model inputs for consumption

Modernize Your Data Strategy with Estrada

Navigating the complexities of modern ETL/ELT and building a scalable data foundation on platforms like Databricks requires deep expertise. If you’re ready to move beyond theoretical guides and implement a robust data strategy that drives real business value, our team of data engineering experts is here to help.

Contact us today to schedule a consultation.

Abstract visualization of glowing interconnected data structures representing foreign keys and data relationships, vital for AI readiness in a modern cloud analytics environment.

Foreign Keys in Modern Analytics and AI Readiness

Why Foreign Keys Still Matter in Modern Analytics and AI Readiness

Presented by: Eduardo Sobrino, Estrada Consulting Inc
BI/EDW Data, Analytics and AI Practice Manager


AI-Ready Data Models: Why Constraints Still Matter

While reviewing a data architecture for a Fortune 500 client, I was taken aback to discover a key project that was completely lacking Primary and Foreign Key constraints. It drove home the point: if a high-profile project can skip them, countless others likely do too. Always define constraints—even if enforcement is optional. The benefits include:

  • Documentation and Metadata Management
  • Enable Semantic Models and BI Integration
  • Foundation for Data Governance and Lineage
  • Validation and Quality Control (Optional Enforcement)
  • Improve AI Readiness (learn more about what makes data truly AI-ready)

In today’s data-driven enterprise landscape, the consistent definition and inclusion of Primary Keys (PKs) and Foreign Keys (FKs) serve as foundational elements that significantly enhance the AI readiness of data ecosystems. Even in modern analytics platforms where enforcement of these constraints is optional or unsupported, their presence acts as crucial metadata—offering clarity in data relationships, improving data discoverability, and enabling automated lineage tracking. This structural information becomes a vital asset when integrating with semantic models, business intelligence platforms, and machine learning pipelines that rely on relational context to derive insights and enable accurate feature engineering.

Furthermore, PKs and FKs underpin the integrity and interpretability of data, which is paramount for responsible AI deployment. As AI systems increasingly depend on structured, reliable data to learn and operate effectively, the explicit articulation of entity relationships contributes to improved data quality, minimizes ambiguity, and supports governance frameworks. In essence, by embedding these constraints, organizations lay a solid groundwork for scalable, explainable, and auditable AI solutions—accelerating innovation while reinforcing trust and compliance in data-driven decision-making.


Diving Deeper: How Constraints Drive AI Readiness

Data modeling for AI readiness involves several key aspects to ensure that data is structured, clean, and optimized for AI applications. Ensuring AI readiness in analytical platforms is crucial, even if constraints like Primary Key (PK) and Foreign Key (FK) are not enforced by the platform itself. Here are key aspects to consider:

  • Data Quality: High-quality data is essential for accurate AI predictions. Constraints help maintain data integrity and consistency, which are foundational for reliable AI models. High-quality data leads to more accurate AI predictions and insights.
  • Data Governance: Implementing constraints contributes to better data governance by ensuring data adheres to predefined rules and standards. This helps maintain high data quality, which is critical for AI readiness.
  • Semantic Clarity: Defining relationships through constraints clarifies the meaning of data. Even if not enforced, these constraints help AI models understand the context and relationships within the data.
  • Optimization: Constraints can optimize query performance, enabling faster and more efficient data processing. This is vital for handling large datasets in AI applications.
  • Documentation: Constraints serve as documentation of data relationships, aiding in understanding data flow and making informed decisions during AI model development.
  • Contextualization: Adding business context to the data by adding those constraints makes it more meaningful for AI applications. This involves annotating data with relevant information that AI models can use to generate more accurate and actionable insights.

Even though analytical platforms like Azure Synapse Analytics, Microsoft Fabric, Snowflake and others may not enforce these constraints, defining them still plays a significant role in preparing data for AI. They help ensure that the data is structured, clean, and optimized, making it ready for AI applications. By focusing on these aspects, organizations can build robust data models that support successful AI initiatives, leading to reliable and valuable outcomes. Estrada Consulting Inc. offers expert guidance in this area through our AI and Data Readiness Services.


The Role of Constraints in Modern Analytics Platforms

In modern analytical platforms, I consistently add as much metadata as permitted—including definitions of Primary Keys (PKs) and Foreign Keys (FKs)—with the understanding that these constraints are often informational rather than strictly enforced. Their enforcement can vary depending on the specific platform and configuration.

For example (to name a few):

Databricks: PK and FK constraints are available but not enforced by the Databricks engine itself. They can be used to indicate data integrity relationships and optimize queries, but enforcement typically happens upstream in the data ingestion pipeline.

Azure Synapse Analytics: PK constraints are supported but only when they are nonclustered and not enforced. FK constraints can be declared in dedicated SQL pools but are not enforced; they are informational only. The foreign key metadata is used for query optimization only.

Microsoft Fabric: PK and FK constraints are supported but not enforced. PK constraints must be nonclustered, and FK constraints are used to define relationships but are not enforced.

Snowflake: PK and FK constraints are supported but not enforced for standard tables. However, for hybrid tables, PK constraints are required and enforced, and FK constraints are also enforced.

dbt Cloud and dbt Core: Custom constraints, including PK and FK, can be configured on models, but the support and syntax vary depending on the data warehouse.


Why Define Foreign Keys in Modern Analytics Platforms?

Although platforms like Microsoft Fabric, Azure Synapse, Databricks, and Snowflake are designed to handle big data and distributed query processing—and may not enforce foreign keys at the storage or query level by default—it is still valuable to define them for logical modeling and semantic clarity:

1. Documentation and Metadata Management

Defining FKs provides explicit documentation of relationships between tables (e.g., Customer → Orders, Product → Sales). Tools like Microsoft Fabric’s Lakehouse schema or Synapse Studio’s database designer will surface these relationships in diagrammatic form. This enables better onboarding and understanding for analysts, engineers, and stakeholders who interact with the model.

2. Enable Semantic Models and BI Integration

When building semantic models (Power BI, Looker, Tableau, etc.), FKs guide the creation of correct joins and aggregations in reporting tools. Microsoft Fabric and Synapse work closely with Power BI datasets—a well-defined FK improves the auto-detection of relationships in these tools.

3. Foundation for Data Governance and Lineage

FKs help define entity-level dependencies in data lineage tools. Platforms like Purview (Azure) or Unity Catalog (Databricks) can leverage metadata about these relationships to track how data flows between entities.

4. Validation and Quality Control (Optional Enforcement)

Even if not enforced at the engine level, some systems allow for optional constraint validation. FKs can serve as rules for integrity checks in ETL/ELT pipelines—alerting if orphan records are loaded.


Why Foreign Keys Aren’t Enforced in Modern Platforms

Platforms like Snowflake, Databricks, and Synapse Dedicated SQL Pools are designed for highly parallelized workloads across distributed storage. Enforcing FKs in such architectures could:

  • Cause performance penalties for every write operation.
  • Conflict with schema-on-read approaches in data lakes.

But a lack of enforcement does not mean the definition has no value. The FK still improves logical clarity even if not physically enforced.


How FK Relationships Promote Data Model Clarity in Data Warehouses and Data Lakes

Foreign keys—whether enforced or logical-only—play a crucial role in improving the understandability and usability of large-scale data models, especially in analytical environments:

Provides Context Across Multiple Entities

Instead of isolated tables, a FK-connected schema shows how entities are linked in a business process:

  • Sales → Customer → Region
  • Orders → Product → Supplier

These relationships clarify navigation paths for reporting and analysis.

Supports Query Optimization and Join Paths

In some engines, FKs (even without enforcement) can:

  • Allow query optimizers to choose better join strategies.
  • Avoid Cartesian products or ambiguous joins in ad-hoc querying.

Enables Automated Data Modeling

BI tools and semantic layers often use FKs to:

  • Auto-generate relationship diagrams.
  • Suggest default join keys.
  • Validate dimensional models (star/snowflake schemas).

Without FK definitions, these tools might:

  • Suggest incorrect relationships
  • Require more manual modeling effort
  • Risk analytical errors from faulty joins

Facilitates Data Governance and Impact Analysis

With FK relationships:

  • Data lineage tools can map how a change in one table cascades.
  • Easier to assess downstream impacts of schema changes.

Even if Microsoft Fabric, Azure Synapse, Databricks, and Snowflake don’t enforce foreign keys at the engine level, defining FKs is valuable for:

  • Model clarity and documentation
  • Semantic layer and BI tools integration
  • Data lineage and governance
  • Query consistency and standardization

FKs transform a collection of tables into an organized model—forming the foundation for reliable insights in a data warehouse or data lakehouse.


When It’s Especially Applicable

Defining FKs and relationships is especially critical when:

  • Building a curated, governed data warehouse (structured reporting).
  • Creating a semantic layer on top of a lakehouse (Power BI, dbt models).
  • Supporting business intelligence use cases that span multiple domains.

Less critical (but still useful for documentation) in:

  • Raw data lakes or landing zones where schema is evolving.
  • Unstructured or semi-structured data ingestion (e.g., JSON blobs, logs).

Implementing Foreign Keys

Microsoft Fabric: Foreign Keys and Relationships in the Lakehouse / Warehouse

In Microsoft Fabric, you can define relationships explicitly in the Lakehouse (OneLake) or Warehouse models:

Lakehouse scenario:

  • Tables are stored in Delta format (parquet with transaction logs).
  • You can use the Model View in Power BI or Fabric’s semantic model editor to visually create relationships.
  • Even though Fabric Lakehouses don’t enforce FKs at the storage level, semantic models respect these relationships through:
    • Report-level auto-joins
    • Query folding optimization
    • Auto-generated diagrams

Example diagram: Given Customer, Sales, and Product tables

Sales.CustomerID → Customer.CustomerID
Sales.ProductID → Product.ProductID

In SQL:

ALTER TABLE Sales
ADD CONSTRAINT FK_Sales_Customer
FOREIGN KEY (CustomerID) REFERENCES Customer(CustomerID) NOT ENFORCED;

In the Fabric Model View:

  • Arrows linking these tables are shown.
  • Power BI will use these links to auto-join tables in visuals without requiring manual join conditions.

Practical benefit:
Analysts dragging CustomerName and SalesAmount into a report will get correct aggregation without needing to know the join keys.

Azure Synapse: Foreign Keys in Dedicated and Serverless Pools

In Synapse Dedicated SQL Pools:

You can define FKs using standard SQL DDL:

ALTER TABLE Sales
ADD CONSTRAINT FK_Sales_Customer
FOREIGN KEY (CustomerID) REFERENCES Customer(CustomerID);

However, enforcement is not active—Synapse stores the constraint as metadata only, with no runtime check.

In Synapse Studio’s Database Designer:

  • Defined FKs show up as lines connecting tables in the schema diagram.
  • Relationships are leveraged for:
    • Auto-generation of star/snowflake schemas
    • Power BI semantic models created from Synapse datasets
    • Query hints for optimizers (in some cases)

In serverless SQL pools, schema-on-read doesn’t support FK constraints, but you can still represent relationships in external tools.

Databricks: Foreign Keys via Metadata and BI Models

In Databricks (Unity Catalog + Lakehouse):

  • Delta tables don’t enforce FKs at the engine level.
  • You can define FKs as metadata annotations in Unity Catalog or via dbt models.

In SQL:

ALTER TABLE Sales
ADD CONSTRAINT FK_Sales_Customer
FOREIGN KEY (CustomerID) REFERENCES Customer(CustomerID) NOT ENFORCED RELY;

Popular approach: Use dbt (Data Build Tool) to declare relationships (YAML):

- name: sales
  description: "Sales fact table"
  columns:
    - name: customer_id
      description: "FK to customer table"
      tests:
        - relationships:
          to: ref('customer')
          field: customer_id

This doesn’t enforce at query time but allows:

  • Validation tests in your CI/CD pipelines
  • Graph visualization in dbt docs
  • Integration with Power BI and Tableau semantic layers

Understand that the above does not create a physical foreign key in the database but instead, it adds a test to be run by dbt test. The relationships test ensures that every value of a given key exists in the referenced key.

In Databricks SQL dashboard schema view, you’ll see logical connections if modeled this way.

Snowflake: Defining Foreign Keys in the Cloud Warehouse

In Snowflake, you can define foreign keys like in traditional SQL:

ALTER TABLE SALES
ADD CONSTRAINT FK_SALES_CUSTOMER
FOREIGN KEY (CUSTOMER_ID) REFERENCES CUSTOMER(CUSTOMER_ID);

By default:

  • FK constraints are stored for metadata only (NOT ENFORCED) unless explicitly validated at creation.
  • They appear in information schema and schema diagrams in Snowsight UI.
  • Used by BI tools to auto-detect relationships when connecting to Snowflake.

In Snowsight Schema View:

  • Tables with FK relationships show connecting lines.
  • Helpful for team data modeling and understanding dependencies.

Key Benefits:

Even when FKs aren’t enforced at query/runtime, they are valuable for:

  • Making schema diagrams automatically understandable.
  • Enabling correct default joins in Power BI/Tableau/Looker.
  • Providing metadata clarity for governance, lineage, and onboarding.
  • In Microsoft Fabric and Synapse, these definitions power the semantic models that downstream users will consume—meaning less manual configuration in reports, fewer errors in joins, and easier schema maintenance.

Importance of Defining Foreign Keys

Foreign keys should be defined in modern data platforms like Microsoft Fabric, Azure Synapse, Databricks, and Snowflake for several important reasons, despite these platforms not always enforcing referential integrity in the same way as traditional RDBMS:

Key Reasons to Define Foreign Keys

  1. Data Modeling Clarity
    • Documents relationships between tables explicitly
    • Makes data models self-documenting
    • Helps analysts and data scientists understand table relationships
  2. Query Optimization
    • Provides hints to query optimizers about join paths
    • Can improve join performance in some platforms
    • Helps with join predicate pushdown optimizations
  3. Data Quality & Governance
    • Enables data lineage tracking
    • Supports data discovery tools
    • Facilitates impact analysis when schema changes
  4. BI & Visualization Tools
    • Many tools (Power BI, Tableau) auto-detect relationships based on FK constraints
    • Enables correct default join behaviors in reporting tools
    • Improves semantic model generation
  5. ETL/ELT Processes
    • Guides data loading sequences (parent tables before child tables)
    • Helps identify dependency chains in transformation logic

Platform-Specific Considerations

Microsoft Fabric

  • Power BI automatically detects relationships for semantic models
  • Helps with OneLake data organization and discovery

Azure Synapse

  • SQL pool optimizer can use FK hints for distributed query plans
  • Important for Synapse serverless SQL metadata discovery

Databricks

  • Delta Lake constraints (including FK) help with data validation
  • Improves Unity Catalog metadata and discovery
  • Helps with Databricks SQL performance

Snowflake

  • Query optimizer can use FK declarations as optimization hints
  • Important for Snowflake’s data sharing and cloning features
  • Enhances Snowsight’s relationship visualization

While these platforms don’t always enforce referential integrity like traditional databases (unless explicitly configured to do so), declaring foreign keys remains a best practice for metadata management, query optimization, and overall data governance.


Final Thoughts

Bottom line, always add constraints even if they are not enforced. By doing so, it adds clarity to the model and helps to communicate the relationships and semantics. When data entities are clearly defined within your Data Catalog, the strategic advantages for your analytics and AI initiatives become readily apparent, empowering more insightful and reliable decision-making.

Ready to ensure your data architecture is optimized for modern analytics and prepared for the demands of AI? The team at Estrada Consulting Inc. is here to help. Schedule a no-obligation consultation with us today to discuss how we can support your data journey.

1 2 3 … 8